
Many charts that I find interesting are up materially (the percentages next to the stock ticker are very rough as is the three month time frame). New highs seem to be consumer facing with disconnected valuations (e.g., SHOP price/sales is 71 versus AMZN p/s of 4):
- ABNB 80% in roughly 3 months (new highs),
- BIDU 100% (new highs),
- LYFT 120% (new highs),
- PDD 150% (new highs),
- PYPL 70% (new highs),
- QQQ 20% (new highs),
- SHOP 60% (new highs),
- SPY 20% (new highs), and
- USO 60% (new highs).

Fuel cell names have recently dropped from their highs (but anyone following PLUG should not be surprised) along with DIS and UBER (which are both consumer facing names but with earnings reports):
- BLDP 100% (recent drop from new highs),
- DIS 60% (recent drop from new highs),
- UBER 70% (recent drop from new highs), and
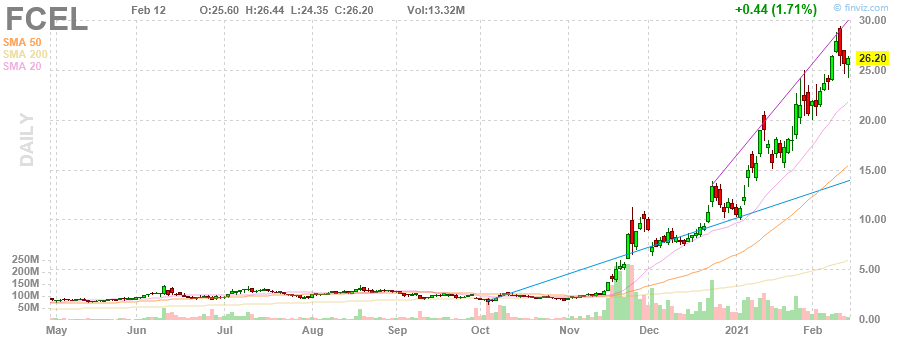
- FCEL 500% (sharp drop from highs).

Double top formations:
- BLNK 200% (double top),
- GM 90% (double top 2 months), and
- JPM 40% (double top 2 months).

Stalled names, former market leaders:
- GE 100% (stalled 2 months),
- PLUG 360% (stalled 2 months), and
- TSLA 125% (stalled 2 months).


Weirdly, PLUG and TSLA seem to have nearly the same chart.
