
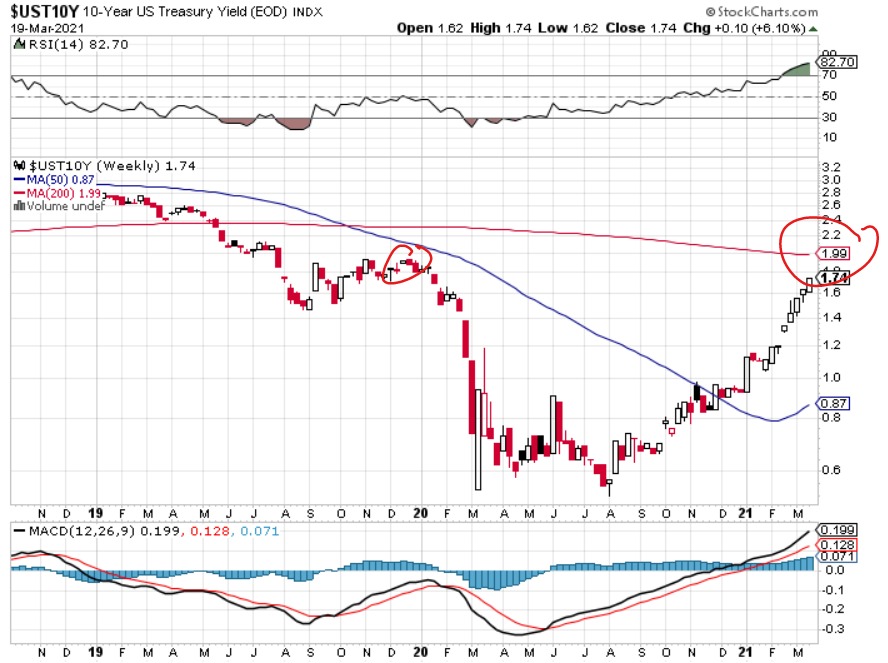
The most important chart of the week belongs to the 10 year treasury yield as it breached 1.7%. The overall effect of these new interim highs, and the considerable loss in bond values, has been the end of the recent bounce in equities for the most part.
Thus we are once again at critical levels with many charts at their lower parallel or price box. The process is taking some time, however, so it may well be that the entire month of March will be the pivot.
lower parallel in sight again 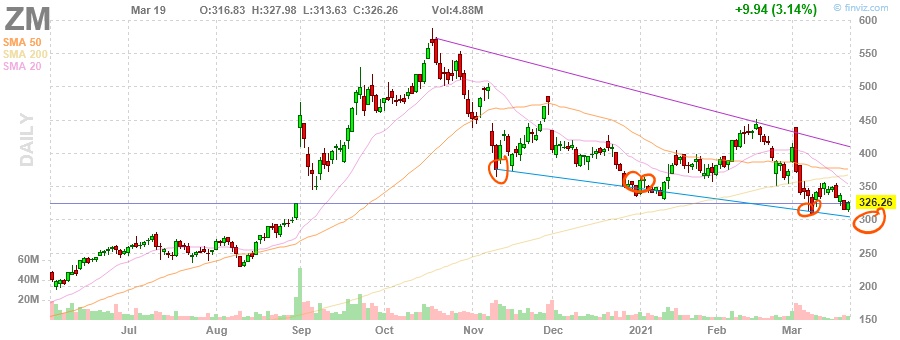
$300 and lower parallel in sight 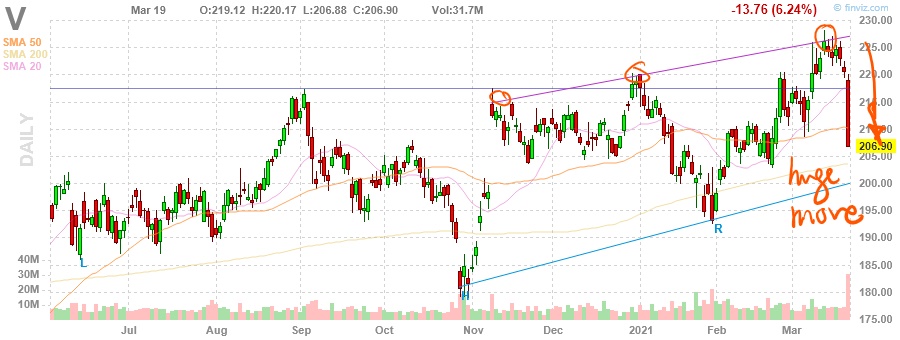
very sharp drop from upper parallel, like MA but worse 
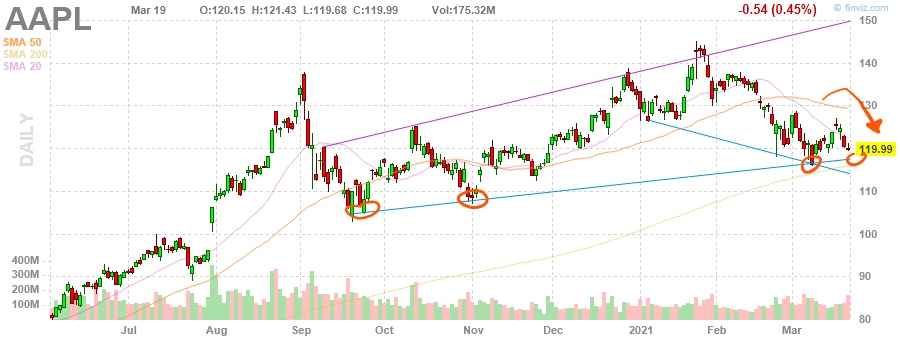
not quite at lower parallel yet 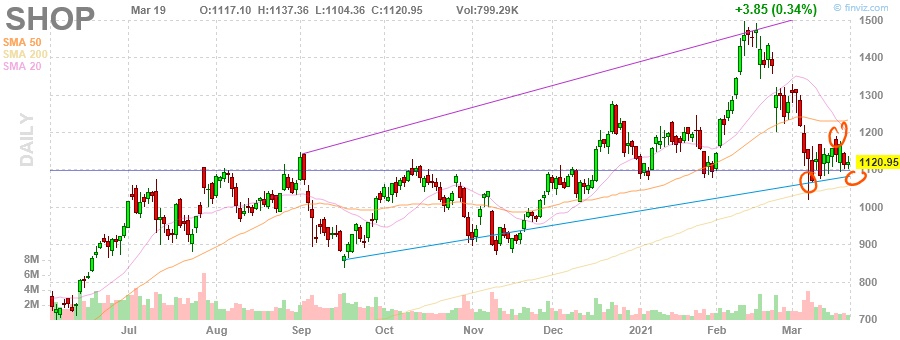
lower parallel in sight despite bounce 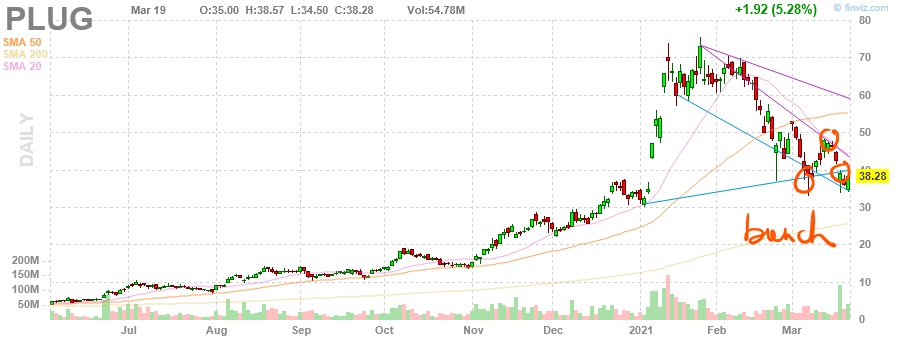
breach of lower parallel despite bounce 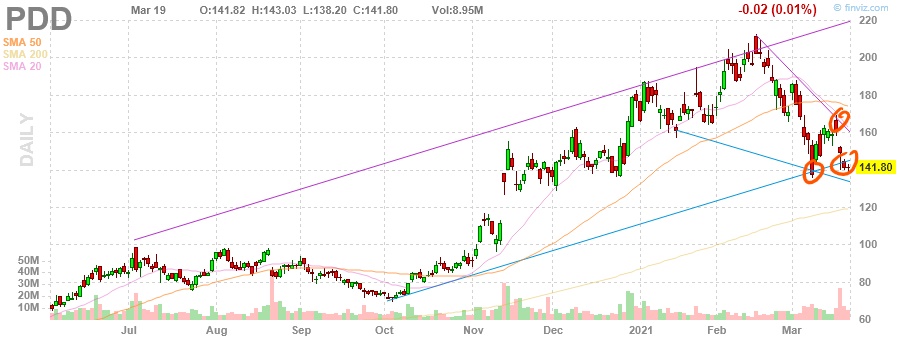
breach of lower parallel despite bounce 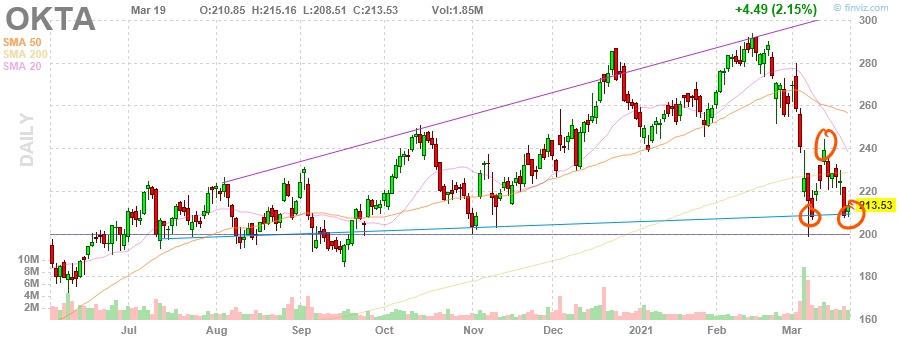
bounce gone, lower parallel in play 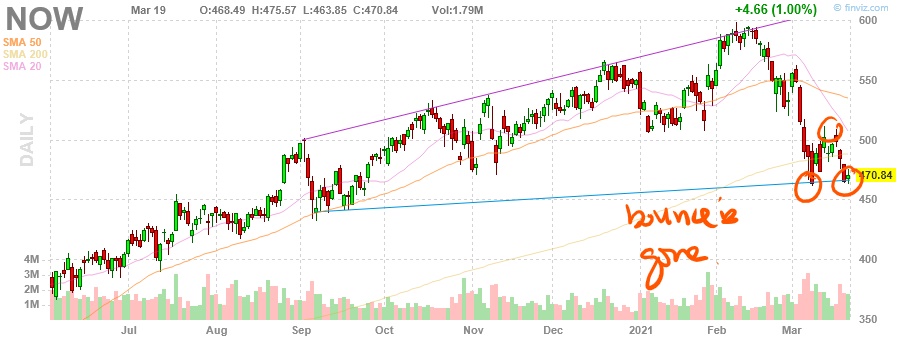
another name where the bounce is completely gone and price is back at the lower parallel 
breach of lower parallel puts price box in the frame 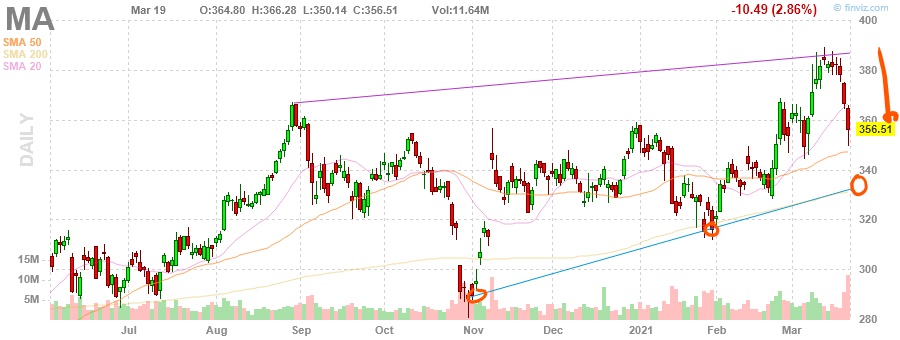
sharp drop from upper parallel 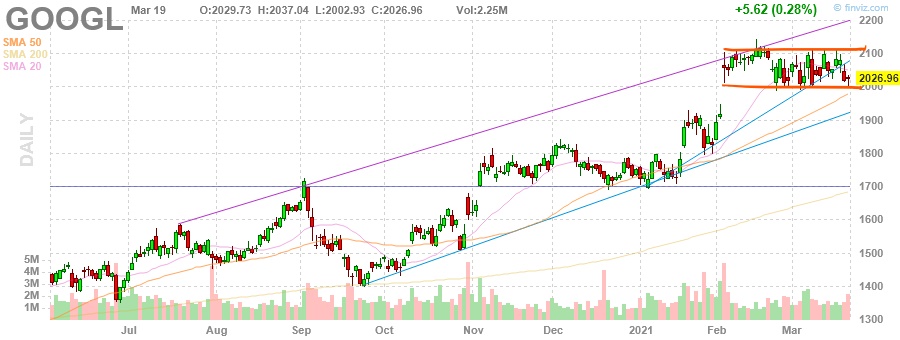
at the bottom of a narrow range since February 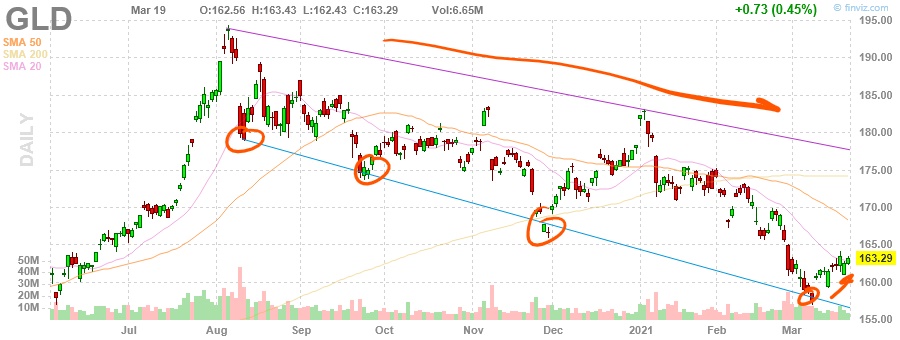
Gold is bouncing in a downward trend 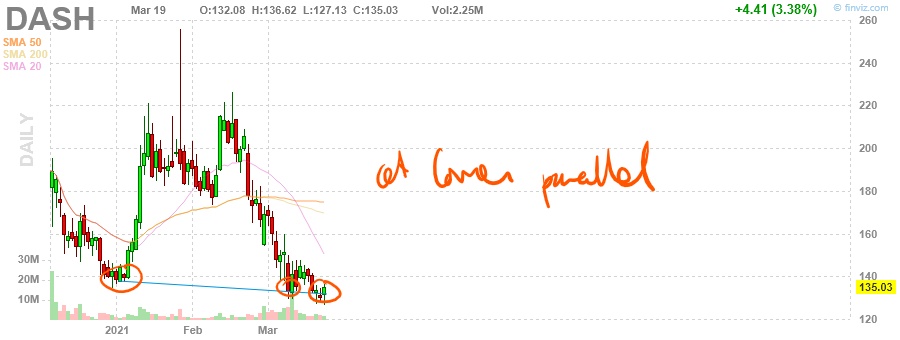
lower parallel 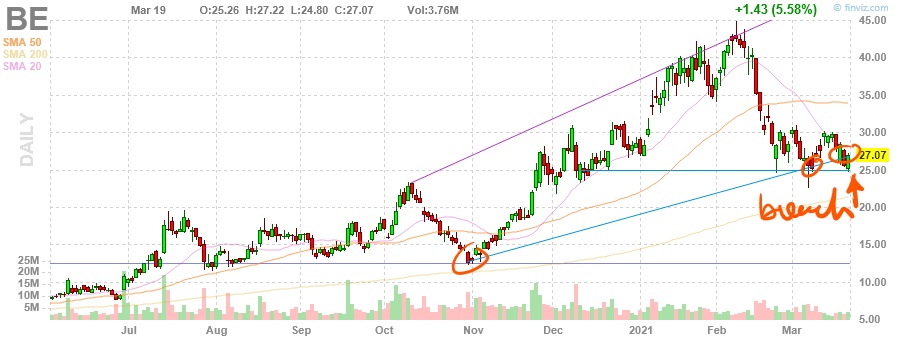
already breached lower parallel despite bounce from lower parallel
While it seems clear that equities should be going lower as the 10 year approaches 2% and beyond there have been a lot of odd bounces in the interim. The clearest confirmation that the trend has indeed changed may well be if GOOGL breaches $2,000 and stays below that price box.
The previously strong MA and V (at least last month) are having a rough March. Gold has been in a downtrend since August but has been steadily rising off its lower parallel since early March.
TSLA weakens, VW and GM rise, but analysts who previously were so prompt and loud in their positive reports and speculations about how TSLA should be ever more valuable were curiously silent when highly consequential negative developments, like the VW battery day and huge market share targets, or any number of smaller negative points, came out. If analysts can only pile in on what they view as positive developments they are not of much use. Pretending that one of the biggest developments in 10 years did not happen may well protect their underwriting fees, but really.
